 Skip to content

Core Web Vitals: What They Are and How to Improve Them
Core Web Vitals measure loading (LCP), responsiveness (INP), and visual stability (CLS) for real users. What each means, how to measure with lab and field data, and how to fix the common causes.
Quick Answer
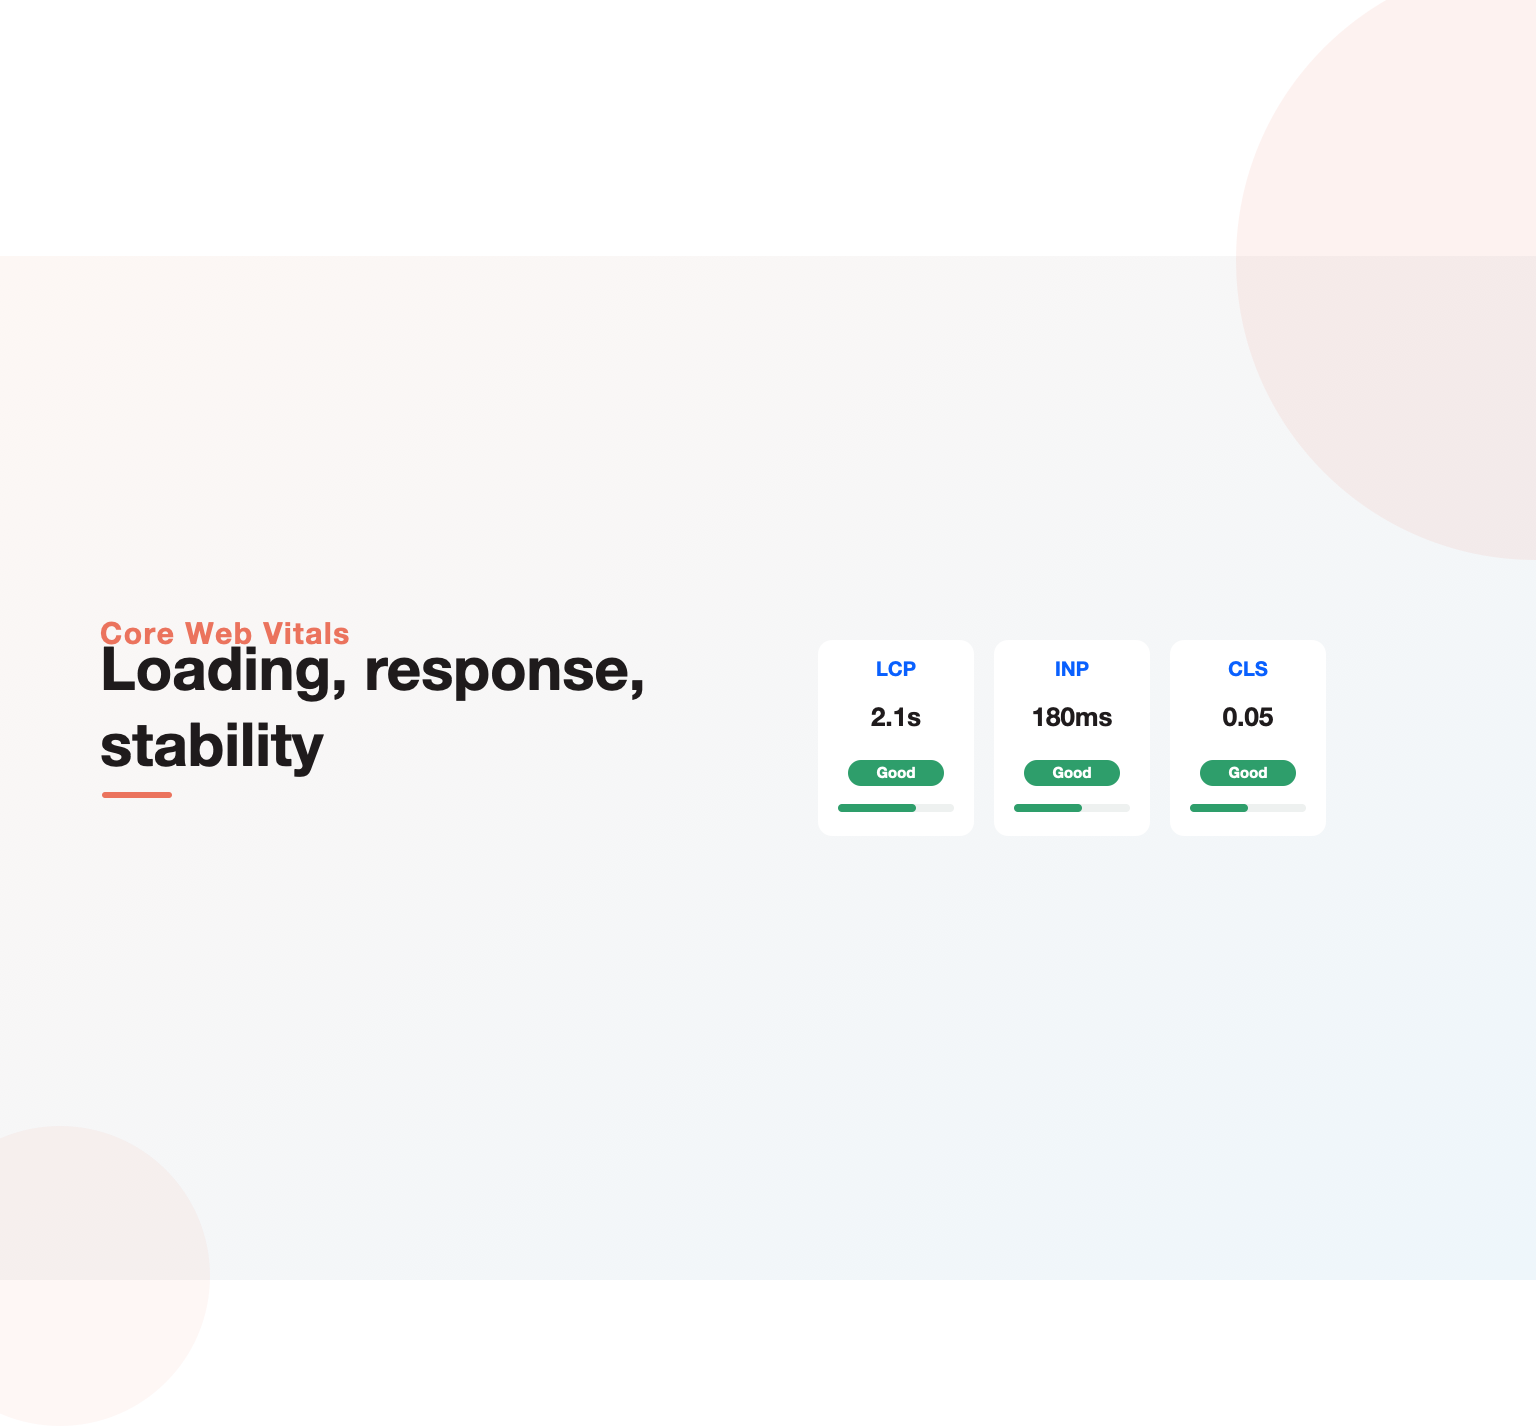
Core Web Vitals are the three metrics Google uses to measure real-world page experience: Largest Contentful Paint, which times how fast the main content loads; Interaction to Next Paint, which measures how quickly the page responds to input; and Cumulative Layout Shift, which captures how much the layout moves around unexpectedly. Together they score loading, responsiveness, and visual stability from the perspective of actual users, and they feed into Google’s ranking systems as a tiebreaker among pages of similar relevance. Improving them is a matter of shipping less and smarter code, optimizing images, reducing and deferring JavaScript, reserving space for elements, so pages load fast, react instantly, and stay put while people read.
Key Highlights
- The three metrics are LCP (loading), INP (responsiveness, which replaced First Input Delay in 2024), and CLS (visual stability), each with a clear good, needs-improvement, and poor threshold.
- They are measured on real users in the field, not just in lab tests, so what Google scores is the experience your actual visitors get on their real devices and connections.
- As a ranking factor they act as a tiebreaker, not a magic lever: great scores will not save weak content, but poor scores can hold back a page that otherwise deserves to rank.
- Most problems trace back to heavy images, excessive JavaScript, render-blocking resources, and elements that load without reserved space, all of which are fixable.
- The bigger prize is conversion: faster, more stable pages keep more visitors and convert better, so the work pays back in revenue as well as rankings.
What Core Web Vitals are
Core Web Vitals are a specific set of three metrics that quantify the quality of a page’s user experience, and each isolates a different way a page can frustrate someone. Largest Contentful Paint measures loading performance by timing how long it takes for the largest visible element, usually a hero image or a block of text, to render. A good LCP is 2.5 seconds or less; anything past four seconds is considered poor. It answers the question users care about most on arrival: how quickly did the page actually become useful.
Interaction to Next Paint measures responsiveness by capturing how long the page takes to visually respond after a user interacts, a tap, a click, a keypress, across the whole visit rather than just the first interaction. It replaced First Input Delay in 2024 because it reflects real interactivity far better, and a good INP is 200 milliseconds or less. Cumulative Layout Shift measures visual stability by scoring how much visible content shifts position unexpectedly while the page loads, the maddening experience of tapping a button that jumps as an ad or image loads late. A good CLS is 0.1 or below. Together these three, defined on Google’s web.dev, give a rounded picture of loading, responsiveness, and stability that maps closely to how people actually perceive a page.
Why Core Web Vitals matter for SEO
These metrics matter because Google made them part of its page-experience signals, so they influence rankings, but the influence is often misunderstood. They act as a tiebreaker rather than a dominant factor: between two pages with comparable relevance and authority, the one that delivers a better experience can win, but strong vitals will not lift thin or irrelevant content, and weak vitals will not necessarily sink a uniquely valuable page. The honest framing is that they are a meaningful edge and a real handicap at the extremes, not a shortcut to the top.
The larger reason to care is that these metrics measure things that directly affect revenue. Slow loading, laggy interactions, and shifting layouts drive people away before they convert, so improving the numbers lifts engagement, reduces bounce, and increases conversions regardless of the ranking effect. This is why performance work sits at the heart of page experience, and why our SEO consulting treats it as foundational technical work rather than an afterthought. Good vitals are where technical SEO and conversion optimization meet, which is what makes them worth the engineering effort.
Largest Contentful Paint: loading
Largest Contentful Paint is usually the first vital to tackle because loading speed shapes the entire first impression. It is driven by how quickly the server responds, how fast critical resources download, and how soon the largest element can render. The most common culprits are oversized, unoptimized hero images, slow server response times, and render-blocking CSS and JavaScript that delay the browser from painting content. On many sites a single enormous hero image is the whole problem.
Fixing LCP is a sequence of targeted moves. Compress and correctly size images, serve them in modern formats, and use responsive images so a phone does not download a desktop-sized file. Preload the critical hero resource so the browser fetches it early, a technique Google documents for LCP, and make sure the server or a content delivery network responds quickly. Eliminate render-blocking resources by inlining critical styles and deferring the rest, and reduce the JavaScript that has to run before content appears. Serving meaningful content through server-side rendering or static generation, rather than waiting for a client-side bundle, also helps LCP directly, which is one more reason rendering strategy and performance are tightly linked.
Interaction to Next Paint: responsiveness
Interaction to Next Paint reflects how alive a page feels when people use it, and its enemy is almost always JavaScript. When the browser’s main thread is busy executing scripts, it cannot respond to a tap or click, so the page feels frozen for a moment, and that delay is what INP captures across every interaction in a visit. Heavy third-party tags, large bundles, and long tasks that block the main thread are the usual causes, which is why interaction-heavy pages loaded with analytics and widgets tend to score worst.
Improving INP means giving the main thread room to breathe. Break up long JavaScript tasks so the browser can respond between them, defer or lazy-load non-essential scripts, and audit third-party tags ruthlessly, since each one competes for the same thread. Reduce the total amount of JavaScript shipped through code-splitting so each page loads only what it needs, and move heavy work off the main thread where possible. The pattern is consistent across the vitals: shipping less JavaScript and being deliberate about when it runs improves responsiveness, and the same discipline behind good JavaScript SEO that keeps a site crawlable and fast keeps it responsive too.
Getting traffic that does not turn into customers?
Our team reviews your current setup and shows you where the opportunities are. See how our SXO services work.
Cumulative Layout Shift: visual stability
Cumulative Layout Shift measures the jarring experience of content moving after it appears, and unlike the other two it is often the cheapest to fix once you know the causes. The classic offenders are images and videos without dimensions, so the browser does not reserve space and everything below jumps when they load; ads and embeds that inject themselves into the flow; and web fonts that swap in and reflow text. Each one moves content out from under a reader or, worse, under their finger just as they tap.
The fixes are mostly about reserving space in advance. Always set width and height attributes or a CSS aspect ratio on images and video so the browser holds the right space before they load. Reserve fixed slots for ads, embeds, and anything injected dynamically so late-loading content does not push the page around. Handle web fonts so text does not violently reflow when the custom font arrives, using size-adjusted fallbacks and sensible loading strategies. Because CLS problems are visible and specific, a careful pass through a page usually finds and fixes most of them quickly, and the payoff in perceived quality is immediate.
How to measure Core Web Vitals
Measuring The vitals correctly means understanding the difference between lab and field data, because they answer different questions. Lab data comes from a controlled test of a single page in a simulated environment, tools like Lighthouse and the lab side of PageSpeed Insights, and it is ideal for debugging because it is reproducible and detailed. Field data, also called real-user monitoring, comes from actual visitors on their own devices and networks, and it is what Google actually uses to assess your pages, drawn from the Chrome User Experience Report.
Use both together. PageSpeed Insights shows field data at the top and lab diagnostics below, so you can see how real users experience a page and then debug why. The Search Console Page-experience metrics report groups your whole site’s URLs into good, needs-improvement, and poor buckets using field data, which is the best place to see the site-wide picture and track progress. For live monitoring, the web-vitals JavaScript library can capture the metrics from your own users. The rule is simple: debug in the lab, but judge success by the field data, because that is the experience Google scores and your users actually have.
Common causes and fixes across the vitals
Most The three metrics problems come down to four recurring causes, and the same fixes address several metrics at once. Heavy, unoptimized images hurt LCP and, when unsized, cause CLS, so compressing, sizing, and reserving space for them is high-leverage. Excessive JavaScript hurts both LCP and INP, so reducing, splitting, and deferring it improves loading and responsiveness together. Render-blocking CSS and JavaScript delay the first paint, so inlining what is critical and deferring the rest speeds everything up. And dynamically injected content without reserved space is the main driver of layout shift.
Because the causes overlap, a focused performance pass tends to move all three vitals at once rather than requiring separate projects. Optimize the media, discipline the JavaScript, unblock the critical render path, and reserve space for anything that loads late, and a page that was failing usually moves into the good range across the board. This is ordinary technical hygiene done well, and folding a vitals check into the same routine as a broader technical SEO review keeps the numbers from quietly regressing every time new features or tags are added.
Core Web Vitals by platform
Platforms shape how you approach This scoring even though the metrics are universal. On WordPress, the common issues are bloated themes, too many plugins, and unoptimized images, so the work centers on a lean theme, caching, image optimization, and pruning plugins that inject scripts. On Shopify, you have less control over the underlying stack, so the focus falls on a well-built theme, disciplined app usage since each app can add scripts, and image handling. JavaScript-framework sites face the responsiveness and loading costs of large bundles, so code-splitting, server rendering, and careful third-party management matter most.
Across every platform the priorities are the same even when the levers differ: control image weight, limit and defer JavaScript, and prevent layout shift. The mistake is assuming a platform is either inherently fast or hopeless; almost any stack can reach good The assessment with the right configuration, and almost any stack can fail them when overloaded with heavy themes, apps, and tags. Knowing your platform’s specific pitfalls just tells you where to look first.
How Core Web Vitals fit into the bigger picture
These metrics are the measurable core of a broader idea: that the on-page experience itself is worth optimizing, for users and search together. Speed, stability, responsiveness, mobile usability, and clear layout all shape whether a visitor stays, trusts the page, and converts, so they are best treated as one connected effort rather than isolated fixes. The vitals are the part of that experience Google measures directly, which makes them the natural starting point, and they work best alongside the clarity that solid on-page SEO brings to a page. Track them as one connected effort and progress compounds.
Seen this way, improving The vitals is not a box-ticking exercise for a ranking signal but the entry point to making pages genuinely better to use. The same work that lifts the metrics, faster loading, instant response, stable layout, is what turns more visitors into customers, which is why it belongs alongside content and authority in a complete strategy rather than off in a technical silo. When we build this for clients it runs through our search experience optimization services so performance, content, and experience reinforce each other rather than competing for attention.
How Core Web Vitals scoring actually works
A detail that trips up many teams is how the pass or fail is calculated, because it explains why a fast-looking page can still fail. Google assesses each metric at the 75th percentile of real visits, meaning at least three-quarters of your users must hit the good threshold for the page to pass. A site can feel quick on the developer’s fast laptop and modern phone while failing for the quarter of visitors on older devices and slower connections whose experience actually decides the score. The verdict reflects your real audience, not your test machine.
The data also updates on a rolling 28-day window drawn from the Chrome User Experience Report, the field data set Google collects from real Chrome users, documented in the Chrome UX Report. That lag is why a fix does not change your assessment overnight: lab tools show the improvement immediately, but the field score only shifts as new real-user data accumulates over the following weeks. Google also groups URLs by similar page types, so a fix to a shared template can lift a whole group at once, which is another reason to think in templates rather than individual pages when improving Page-experience metrics across a large site.
Core Web Vitals on mobile
Mobile is where most sites lose their The three metrics, because phones have less processing power, more variable networks, and smaller screens where layout shifts are more disruptive. Since Google evaluates the mobile experience, a site that scores well on desktop but poorly on mobile is judged on the mobile result, and heavy JavaScript that a laptop shrugs off can leave a mid-range phone struggling to stay responsive. The gap between a developer’s device and a typical visitor’s phone is the single most common reason a team is surprised by a failing score.
Optimizing for mobile This scoring means testing on real, mid-tier devices and throttled connections rather than trusting a fast desktop, and being especially disciplined about image weight and JavaScript, which cost far more on constrained hardware. Responsive images that serve appropriately sized files to phones, deferred and split scripts that do not overwhelm a weaker processor, and reserved space that prevents shifts on a small screen all matter more on mobile than anywhere else. Get the mobile experience right and the desktop numbers usually follow, since desktop is the more forgiving environment. A practical habit is to keep a mid-range test phone on a throttled connection and check key templates on it before every release, because that device, not the one on your desk, is a fair proxy for the visitors whose experience decides the score.
A Core Web Vitals audit workflow
A repeatable workflow turns vitals work from guesswork into routine. Start in Search Console’s The assessment report to see which page groups are failing on real-user field data and which metric is the problem, so you fix what actually affects visitors rather than chasing a lab score in isolation. Pick the worst-performing template, since fixing a template cascades across every page built from it, and run its URL through PageSpeed Insights to see the field data and the lab diagnostics side by side.
From there, use a Lighthouse run to get the specific opportunities, the oversized image, the render-blocking script, the layout-shifting element, and address them in order of impact. Fix on a staging copy, confirm the lab score improves, then ship and watch the field data in Search Console catch up over the following weeks. Because a single new feature, plugin, or marketing tag can quietly undo the work, fold this audit into your release process rather than treating it as a one-off, pairing it with the wider technical SEO checklist so performance does not regress every time the site changes. Treated as a habit rather than a project, These metrics stay in the good range instead of drifting back to failing.
Want search traffic that converts, not just visits?
Book a free 30-minute strategy call and leave with a clear next step for your business.
Core Web Vitals myths that waste effort
Several persistent myths lead teams to spend effort in the wrong places. The first is that a perfect Lighthouse score means you pass; it does not, because Lighthouse is a lab test on one simulated device while the assessment that counts comes from real users in the field, so a flawless lab score can sit next to a failing field score. The second is that The vitals are the biggest ranking factor; they are a tiebreaker among comparable pages, and chasing a marginal improvement while ignoring content and authority is misplaced effort. Relevance and usefulness still decide most of the outcome, as our guide to how SEO works lays out.
The third myth is that this is a one-time fix. Scores drift as teams add features, tags, and heavier images over time, so a page that passed six months ago can quietly slip back into failing, which is why monitoring matters as much as the initial work. The fourth is that only the homepage needs attention; in reality the templates that generate your highest-traffic pages, product, article, or landing templates, are where the score and the revenue actually live. Focusing there, rather than on a single showcase page, is what moves the numbers that matter and connects the work to the case for SEO being worth the investment. Chase the myths instead and you can spend weeks polishing a lab score that never changes what real users, or Google, actually experience.
Where Core Web Vitals hit hardest: ecommerce and media sites
Image-heavy and script-heavy sites feel these metrics most acutely, which is why ecommerce and media publishers tend to struggle. A product page carrying large photos, review widgets, recommendation carousels, and a stack of marketing tags is fighting LCP, INP, and CLS all at once, and the same catalog scale that makes the store valuable multiplies the problem across thousands of pages. On these sites the performance work is not cosmetic; slow, unstable pages directly cost sales, so the vitals and the revenue move together.
The playbook for these sites is disciplined media and script management applied at the template level: compress and correctly size every image, lazy-load below-the-fold media without hiding it from crawlers, reserve space so nothing shifts, and audit the third-party tags that accumulate on commercial pages until the main thread is overwhelmed. Because the fixes live in templates, one change lifts the whole catalog, which is the same leverage that makes technical work so valuable in ecommerce SEO generally. For content and publishing sites the pattern is identical, heavy media and ad scripts are the enemy, and taming them lifts both experience and rankings. For the fundamentals behind these metrics, start with our explainer on what is web development.
Key Takeaways
- Page-experience metrics are three real-user metrics, LCP for loading, INP for responsiveness, and CLS for visual stability, each with clear good and poor thresholds.
- They influence rankings as a tiebreaker among comparable pages, so treat them as an edge and a handicap at the extremes, not a shortcut past weak content.
- Measure with both lab tools like Lighthouse and PageSpeed Insights for debugging and field data in Search Console for the verdict Google actually uses.
- Most fixes overlap: optimize and size images, reduce and defer JavaScript, unblock the critical render path, and reserve space for late-loading elements.
- The real payoff is conversion as much as ranking, which is why performance sits at the center of search experience optimization, not off in a technical corner.

Frequently asked questions
What are Core Web Vitals?
The three metrics are three metrics Google uses to measure real-world page experience: Largest Contentful Paint for loading speed, Interaction to Next Paint for responsiveness, and Cumulative Layout Shift for visual stability. Each has a defined good, needs-improvement, and poor threshold, and together they score how fast a page becomes useful, how quickly it responds to input, and how stable it stays while loading, based on the experience of real visitors.
Are Core Web Vitals a ranking factor?
Yes, they are part of Google’s page-experience signals, but they act as a tiebreaker rather than a dominant factor. Between pages of similar relevance and authority, better vitals can give an edge, and very poor vitals can hold a page back, but strong scores will not lift weak or irrelevant content. They are worth improving both for that ranking edge and, more importantly, for the effect on engagement and conversions.
What is a good Core Web Vitals score?
The good thresholds are 2.5 seconds or less for Largest Contentful Paint, 200 milliseconds or less for Interaction to Next Paint, and 0.1 or below for Cumulative Layout Shift. To pass overall, a URL needs to meet the good threshold for all three at the 75th percentile of real users, meaning at least three-quarters of visits hit those targets, which is why field data rather than a single lab test is the true measure.
What replaced First Input Delay?
Interaction to Next Paint replaced First Input Delay as a Core Web Vital in 2024. FID only measured the delay of the first interaction, which made it easy to pass while still feeling sluggish, whereas INP measures responsiveness across all interactions in a visit and reflects real perceived performance far better. Improving INP centers on reducing and breaking up JavaScript so the main thread can respond quickly throughout the session.
How do I measure Core Web Vitals?
Use lab and field data together. PageSpeed Insights shows both real-user field data and lab diagnostics for a page, Lighthouse gives detailed lab results for debugging, and the Search Console This scoring report shows how your whole site performs on field data over time. For live monitoring you can capture the metrics from your own users with the web-vitals JavaScript library. Debug in the lab, but judge success by the field data.
Why are my Core Web Vitals poor?
The usual causes are heavy, unoptimized images and slow server response hurting LCP; excessive or poorly managed JavaScript blocking the main thread and hurting INP; and images, ads, or fonts loading without reserved space causing CLS. Third-party tags and scripts are a frequent shared culprit. The good news is that these are all diagnosable with the standard tools and fixable with image optimization, JavaScript discipline, and reserving space for dynamic content.
How long does it take to improve Core Web Vitals?
The fixes themselves can often be implemented in days to weeks, but because Google uses field data collected over a rolling 28-day window, the improvements take time to show up in Search Console and in how Google assesses your pages. You will see lab scores improve immediately after a fix, then watch the field data catch up over the following weeks as real-user data accumulates on the improved pages, which mirrors the wider reality of how long SEO takes to show results.
Do Core Web Vitals matter for conversions?
Yes, and this is often the bigger reason to invest in them. Faster loading, instant responsiveness, and a stable layout keep more visitors from leaving and make it easier for them to complete actions, so improving the vitals typically lifts engagement and conversions regardless of the ranking effect. That is why performance work belongs at the center of search experience optimization, where technical SEO and conversion optimization meet.
Ready to put this into practice?
Talk to the team that runs SEO, AI search and paid growth programs every day.
Book a Strategy Call →