 Skip to content

Facebook Ads Reporting: Metrics That Actually Matter
Facebook ads reporting should lead with outcome metrics, not vanity numbers. Learn which metrics matter, how to handle attribution, structure reports, and turn measurement into decisions.
Quick Answer
Facebook ads reporting is the practice of measuring and communicating how a Meta advertising account is performing, and doing it well means reporting on the metrics that tie spend to business results rather than the vanity numbers that are easy to move but rarely matter. Good facebook ads reporting starts from the outcome you actually care about, cost per result, return on ad spend, leads or sales, and works back to the diagnostic metrics that explain it, so a report tells a story about what is working, what is not, and what to do next. Because Meta’s own dashboard reports optimistically and its attribution takes generous credit, effective reporting also means reading platform numbers with healthy skepticism, comparing them against your own source of truth like a CRM or ecommerce backend, and watching blended results across the whole account. The goal is not a wall of numbers but a clear, honest picture that drives decisions: which campaigns to fund, which creative to cut, and whether the channel is genuinely making money. This guide covers which metrics matter, how to structure reports, how to handle attribution, and how to turn facebook ads reporting into a tool for better decisions instead of a monthly ritual nobody acts on.
Key Highlights
- Strong facebook ads reporting leads with outcome metrics, cost per result and return on ad spend, not clicks, impressions or vanity engagement.
- Meta’s dashboard reports optimistically and its attribution over-credits, so reports should compare platform numbers against your own source of truth.
- A useful report explains why performance changed and what to do next, rather than listing numbers nobody acts on.
- Blended metrics across the whole account guard against being fooled by attribution overlap on retargeting.
- Custom columns, breakdowns and saved reports in Ads Manager make reporting repeatable instead of manual each time.
- Reporting cadence should match the decision: daily for spend safety, weekly for optimization, monthly for strategy.
Start reporting from the outcome, not the dashboard
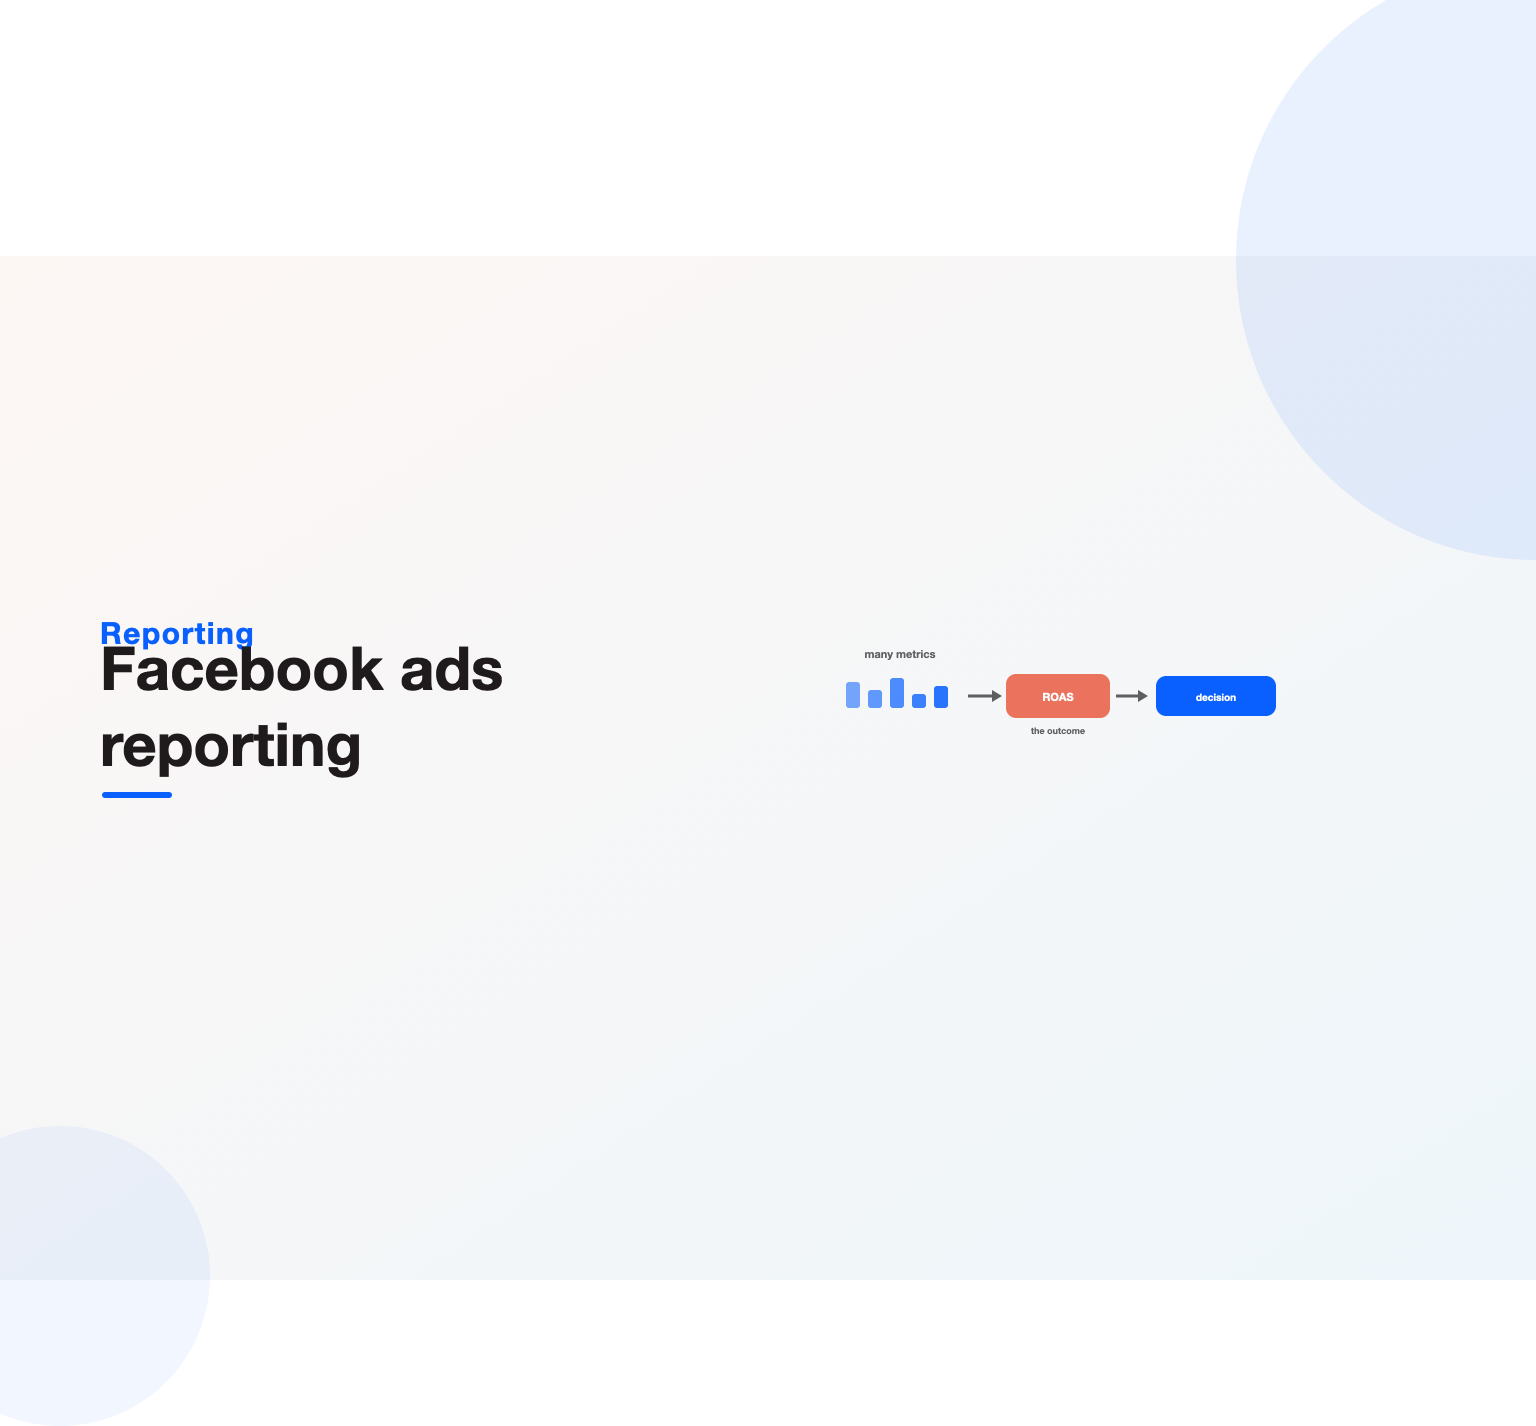
The most common mistake in facebook ads reporting is starting from whatever Ads Manager shows by default and treating that as the report, when good reporting starts from the business outcome and works backward. Before opening a single dashboard, name the result the account exists to produce, a sale at a target return, a lead at a viable cost, a booking, and make that the headline of every report. Everything else in the report exists to explain that headline number, which keeps the focus on what the business actually cares about rather than the metrics the platform happens to surface first. A report built this way answers the only question leadership really has: is this channel working, and is it worth more money.
Working backward from the outcome also disciplines which metrics earn a place in the report. Once the headline is cost per result or return on ad spend, the supporting metrics are the ones that explain movement in it, and everything that does not help explain or act on the outcome is clutter. This is why facebook ads reporting improves the moment you delete half the columns most people track, because a shorter report focused on outcomes and their drivers is read and acted on, while a sprawling one is skimmed and ignored. The reports that change decisions are the ones that connect spend to results in a way a busy reader can grasp in seconds, which is the whole point of measuring at all, and a discipline that pairs naturally with real facebook ads optimization.
The metrics that actually matter
The metrics worth building facebook ads reporting around are the ones closest to money, and they sit in a rough hierarchy from outcome to diagnostic. At the top are cost per result and return on ad spend, the numbers that tell you whether the account produces business value efficiently. Just beneath them sit conversion volume and cost per acquisition, which show whether the account is delivering enough results at a viable price. These outcome and near-outcome metrics belong at the front of every report because they decide funding and strategy, and everything below them is there to explain why they moved.
The diagnostic metrics, click-through rate, cost per click, conversion rate, frequency, and the like, matter as explanations rather than goals. A rising cost per result becomes actionable when the diagnostics show why: a falling click-through rate points to creative fatigue, a climbing frequency points to a saturated audience, a dropping conversion rate points to a landing page or offer problem. Reading these as clues to the outcome, rather than as targets in their own right, is what separates diagnostic reporting from vanity reporting. The metrics to keep out of the headline are the pure vanity numbers, raw impressions, reach, likes, that move easily and impress in isolation but say nothing about whether the account makes money, and understanding how the outcome connects to facebook ads cost keeps the hierarchy grounded.
Do not trust the dashboard at face value
Meta’s reporting is not neutral, so competent facebook ads reporting treats the platform’s numbers as a claim to verify rather than a fact to record. The dashboard is built to show advertising in a flattering light: it counts view-through conversions generously, attributes sales to ads that may have only brushed against demand you would have won anyway, and defaults to attribution windows that maximize reported results. None of this is fraud, but it means platform-reported return on ad spend routinely overstates the true contribution of advertising, especially on retargeting, where the ads often reach people already on their way to buy.
The remedy is a second source of truth. Comparing Meta’s reported conversions against a CRM for leads or an ecommerce backend for sales reveals the gap between what the platform claims and what actually landed in the business, and that gap is one of the most useful numbers a report can carry. When platform numbers and the backend disagree, the backend usually wins, because it counts real orders and real revenue rather than attributed credit. Building this comparison into facebook ads reporting, rather than accepting the dashboard, is what keeps decisions grounded in reality, and it is a habit that protects budget across every objective, from ecommerce to lead generation.
Read attribution and incrementality honestly
Attribution is where facebook ads reporting gets genuinely hard, because deciding which conversions to credit to Meta is a modeling choice, not a fact, and reasonable methods disagree. The attribution window you pick, one day or seven days after a click, with or without view-through, changes reported results substantially, and the platform’s defaults are the ones most generous to advertising. A report should state the attribution settings it uses and stay consistent, because switching windows between reports makes trends meaningless and invites cherry-picking the flattering number.
Incrementality is the deeper question attribution only approximates: how many of the reported conversions would have happened anyway without the ads. A retargeting campaign can show a spectacular return while adding little, because it reaches people who were already going to buy, so a report that treats attributed return as incremental value overstates the case for that spend. Where the budget justifies it, holdout tests and geo experiments measure true lift, and even a rough sense of incrementality reshapes how you read the numbers. Building reporting that acknowledges attribution’s limits, and reaches for incrementality where it can, is what turns measurement from self-congratulation into decision support, and it underpins sound judgment about scaling any campaign, including facebook retargeting.
Structure a report people actually use
A report earns its keep only if someone reads it and acts, so structuring facebook ads reporting for its audience matters as much as the numbers in it. The shape that works leads with the outcome, a single clear statement of results against goal, follows with a short explanation of what drove the change, and ends with the decisions or recommendations that follow. Leadership needs the headline and the recommendation; a practitioner needs the diagnostics beneath. Serving both without drowning either means layering the report, a top section anyone can grasp in seconds and a detail section for whoever needs it.
Narrative is what most reports lack and most readers want. A table of metrics tells a reader what happened but not why or what to do, so a good report adds a sentence or two of interpretation to the numbers: performance dipped because a top creative fatigued, and here is the fresh creative going live. This is the difference between a report that gets acted on and a spreadsheet that gets filed, and it is why facebook ads reporting is a communication skill as much as an analytical one. The best reports are short, honest, and pointed at a decision, which is exactly what a client should expect from professional Meta Ads management, where reporting is the visible proof that spend is being handled well.
Use Ads Manager columns, breakdowns and saved reports
Ads Manager has the tools to make facebook ads reporting repeatable, and using them well saves hours and reduces error. Custom columns let you build a view showing exactly the outcome and diagnostic metrics that matter to your account, so you are not scrolling past defaults to find the numbers you use. Saving that column set means every future report starts from the right view rather than being rebuilt by hand, which is the difference between reporting that scales and reporting that eats a morning each week.
Breakdowns are the other underused feature, because they turn a flat number into an explanation. Splitting results by placement, device, age, or time reveals where performance concentrates, so a mediocre blended result can hide a strong segment worth scaling and a weak one worth cutting. Reading breakdowns as part of routine reporting surfaces opportunities and problems the top-line number conceals. Combining custom columns, saved report configurations, and regular breakdown analysis turns Ads Manager from a place you visit into a reporting system you operate, and it applies to every account type, including the catalog-driven views behind facebook ads for ecommerce. Meta’s own Ads Manager reporting documentation covers how to build and export these views.
Match cadence to the decision
Reporting cadence should follow the decision it informs, because different questions need different rhythms, and running everything on one schedule wastes effort or misses problems. Daily attention is for safety, catching a runaway spend, a broken pixel, or a campaign that suddenly stops delivering, and it does not need a formal report, just a quick check of the vital signs. Reacting to daily performance swings with changes, by contrast, usually hurts, so daily reporting should watch for breakage, not invite tinkering.
Weekly and monthly cadences carry the real reporting weight. A weekly review is the right rhythm for optimization, enough time for meaningful data to accumulate and for creative and budget decisions to be made deliberately, while a monthly report is where strategy lives, showing trends, testing outcomes, and the direction of the account against its goals. Matching facebook ads reporting to these cadences, daily for safety, weekly for optimization, monthly for strategy, keeps each report focused on the decisions it should drive and prevents the noise of over-frequent reporting from provoking bad reactions. Reading performance over sensible windows rather than reacting to noise is a discipline that protects the account as much as it clarifies it.
Report on creative, not just campaigns
Because creative is the main driver of results on modern Meta, facebook ads reporting that stops at the campaign level misses where performance is actually made or lost. Reporting at the ad and creative level, which hooks, formats, and angles are winning, which are fatiguing, reveals the lever that matters most and turns reporting into a feedback loop for the creative engine. An account that reports only campaign totals knows whether it is up or down; an account that reports on creative knows why, and what to make more of.
Tracking creative performance over time also catches fatigue before it drags the account down. Watching click-through rate and cost per result at the creative level shows when a winning ad starts to tire, so fresh creative can replace it before performance slips, rather than after. This makes creative reporting an early-warning system as well as a scoreboard, and it feeds directly into the testing that keeps an account healthy. Building creative-level reporting into the routine connects measurement to the work that most moves results, and it reinforces the discipline behind strong facebook ad creative and effective facebook video ads.
Set goals and benchmarks before you report
Reporting without a goal is just describing numbers, so useful reporting begins with targets set before the period starts, not judgments invented after the fact. A target cost per acquisition, a required return on ad spend, or a lead volume goal gives every later number a reference point, turning a raw result into a verdict: ahead of target, behind it, or on track. Without that reference, a report can only say what happened, not whether it was good, and a channel that spends heavily can look fine simply because nobody defined what fine meant.
Benchmarks should come from your own account history first and industry figures second, because your break-even economics are specific to your margins and customer value. A return that is healthy for one business loses money for another, so borrowing a competitor’s benchmark can mislead more than it guides. Establishing your own targets from real unit economics, then reporting against them consistently, is what makes a report a scorecard rather than a description. Those same targets make the difference between a genuine problem and normal variance visible, which is why disciplined facebook ads cost tracking belongs alongside them in any serious report. This discipline also keeps expectations honest when you scale, since it separates a genuine efficiency problem from the normal, expected softening of results as spend grows and reach widens.
Report differently for leads and for sales
The right shape of reporting depends on whether the account generates leads or direct sales, because the two have very different distances between the click and the money. For ecommerce, the purchase is immediate and valued, so reporting can lean harder on platform-reported return on ad spend, tempered by a backend check, and read results over shorter windows. The revenue is visible quickly, which makes the feedback loop tight and the reporting relatively direct, though attribution skepticism still applies to retargeting.
Lead generation demands reporting that follows the lead past the form, because cost per lead alone hides whether those leads are any good. A campaign can produce cheap leads that never close and look excellent in a report that stops at the form submission, which is why serious lead reporting tracks lead quality and cost per qualified lead or per customer through the CRM. Connecting Meta’s lead data to what happens downstream, whether a lead became a sale, is the only way to know if the spend works, and it turns reporting into a measure of business impact rather than form fills. That downstream view is central to honest measurement of any lead generation effort, and it changes which campaigns a report tells you to fund.
Look beyond Ads Manager when you need to
Ads Manager is enough for most reporting, but there are moments when a fuller picture requires pulling data together from more than one place. When a business runs Meta alongside Google, email, and other channels, a single-channel report cannot show how they interact or which deserves the next dollar, so a blended dashboard that combines sources gives a truer view of what advertising as a whole is achieving. The point is not more tools for their own sake but a report that matches how the business actually spends and earns.
Connecting Meta data to a CRM or a data warehouse is where reporting becomes genuinely powerful, because it links ad spend to real revenue and lifetime value rather than platform-attributed conversions. That connection lets a report answer questions the dashboard cannot, like which campaigns bring customers who stay and spend, not just which produce the cheapest first purchase. Building toward that kind of joined-up measurement is a gradual investment, and for many businesses it is exactly the capability that thorough Meta Ads management is meant to provide, turning scattered data into a coherent story about what the money is doing.
Common reporting mistakes to avoid
A handful of reporting mistakes recur across accounts, and naming them makes them easier to catch. The first is reporting vanity metrics as if they were results, filling a report with impressions, reach, and engagement that move easily but say nothing about profit. The second is accepting the dashboard uncritically, treating platform-reported return as truth without checking it against a backend, which quietly justifies overspending on retargeting that takes undue credit. The third is inconsistency, changing attribution windows, date ranges, or metric definitions between reports so trends become meaningless and comparisons collapse.
Other mistakes are about how the report communicates rather than what it measures. Burying the outcome under a wall of numbers, offering data with no interpretation, and ending a report with no recommended action all turn reporting into a ritual nobody acts on. Over-frequent reporting causes its own harm by inviting reactions to daily noise that destabilize campaigns, while reporting only at the campaign level hides the creative-level story where performance is actually decided. Avoiding these, by leading with outcomes, verifying the numbers, staying consistent, interpreting rather than listing, and always ending in a decision, is most of what separates facebook ads reporting that improves an account from reporting that merely fills a slide, the same standard that supports strong facebook ads for ecommerce and every other objective.
Turn reporting into decisions
The final test of facebook ads reporting is whether it changes what you do, because a report that produces no decision is wasted effort however polished it looks. Every report should end with a short list of actions the numbers justify: scale this campaign, cut that creative, fix this tracking gap, test this offer. Tying each recommendation to the metric that supports it keeps the report honest and makes the decision easy to defend, and it turns reporting from a backward-looking summary into a forward-looking plan.
Over time, keeping a record of what each report recommended and what happened next builds something more valuable than any single report: a history of decisions and outcomes that sharpens judgment. Reviewing whether last month’s changes produced the expected result closes the loop and improves the next round of decisions, which is how an account gets steadily better run rather than merely watched. Reporting that drives action, records outcomes, and feeds the next decision is the difference between measurement that improves an account and measurement that just documents it, and it is the standard any serious operator, or client of thoughtful Meta ads for D2C brands, should hold reporting to. Accurate reporting depends on clean data, which is why we recommend setting up the Facebook Conversions API.
Key Takeaways
- Build facebook ads reporting around outcome metrics, cost per result and return on ad spend, and use diagnostics only to explain them.
- Treat Meta’s dashboard as a claim to verify against a CRM or backend, since it reports optimistically and over-credits attribution.
- State your attribution settings, keep them consistent, and reach for incrementality tests where the budget justifies it.
- Structure reports to lead with the outcome, explain the change, and end with decisions, layered for both leadership and practitioners.
- Use custom columns, breakdowns and saved reports to make reporting repeatable, and report at the creative level, not just the campaign.
- Match cadence to the decision, daily for safety, weekly for optimization, monthly for strategy, and end every report with actions.

Frequently asked questions
What metrics should a Facebook ads report include?
Lead with outcome metrics, cost per result and return on ad spend, plus conversion volume and cost per acquisition, since these decide whether the account is worth its budget. Support them with a short set of diagnostics, click-through rate, cost per click, conversion rate, and frequency, used to explain why the outcome moved rather than as goals in themselves. Keep pure vanity numbers like raw impressions and likes out of the headline, and add a comparison against your own CRM or ecommerce backend so the report reflects real business results, not just what the dashboard claims. It is also worth reporting a small number of creative-level metrics, since the ad and creative view often explains a change in the outcome that the campaign totals hide, and it points directly at the next thing to make or cut.
Why do Meta’s reported numbers differ from my sales?
Meta’s dashboard reports optimistically and its attribution takes generous credit, counting view-through conversions and attributing sales to ads that may only have touched demand you would have won anyway. That is why platform-reported return on ad spend usually overstates the true contribution of advertising, especially on retargeting. The fix is to compare Meta’s numbers against your own source of truth, a CRM for leads or an ecommerce backend for revenue, and to trust the backend when they disagree, because it counts real orders rather than attributed credit.
How often should I report on Facebook ads?
Match the cadence to the decision. Check vital signs daily for safety, to catch runaway spend, a broken pixel, or a campaign that stops delivering, but do not make changes off daily swings. Run a weekly review for optimization decisions on creative and budget, when enough data has accumulated to act deliberately, and produce a monthly report for strategy, showing trends, test outcomes, and progress against goals. Reporting everything on one schedule either wastes effort or misses problems, so let the question set the rhythm. In practice, a quick daily glance at spend and delivery, a focused weekly review where creative and budget decisions are made, and a fuller monthly report for trends and strategy cover almost every account. The weekly review is usually where the real optimization happens, since it gives creative and budget changes enough data to justify them without reacting to noise, which is exactly the cadence that supports steady facebook ads optimization.
What is a good attribution window for reporting?
There is no single correct window, because attribution is a modeling choice rather than a fact, but the practical rule is to pick a window that reflects how your customers actually decide and then stay consistent. Shorter click-based windows credit advertising more conservatively and tend to align better with incremental value, while longer windows and view-through attribution inflate reported results. Whatever you choose, state it in the report and do not switch between reports, since changing windows makes trends meaningless and invites cherry-picking the flattering number. It also helps to read the same campaign under more than one window occasionally, because the spread between a conservative and a generous window shows how much of the reported result depends on attribution rather than real demand. That spread is often widest on retargeting, which is worth keeping in mind when judging the true contribution of facebook retargeting against colder prospecting.
Can I automate Facebook ads reporting?
Yes, and you should for the repetitive parts. Custom columns and saved report configurations in Ads Manager let every report start from the right view, scheduled email reports can deliver the numbers automatically, and exports or connectors can feed a dashboard that blends Meta data with your backend. Automation handles the data assembly, but the interpretation, explaining why performance changed and recommending what to do, still needs a human who understands the account and the business behind it, because the value of a report is in the decisions it drives, not the numbers it lists. A sensible split is to automate the data assembly and scheduling, then spend the saved time on interpretation and recommendations, since that is where a report actually earns its place. For accounts running catalog-driven campaigns, the same automated views can pull the product-level detail behind facebook ads for ecommerce, so the reporting scales with the account rather than eating more time as it grows. The aim is to let automation carry the routine assembly while a person keeps ownership of the story the report tells and the decisions it recommends.
Ready to put this into practice?
Talk to the team that runs SEO, AI search and paid growth programs every day.
Book a Strategy Call →