 Skip to content

Ecommerce Conversion Rate Optimization: A 90-Day Guide
Ecommerce conversion rate optimization guide: cited benchmarks, product page and checkout fixes, A/B test sizing, ICE scoring and a 90-day plan for stores.
Quick Answer
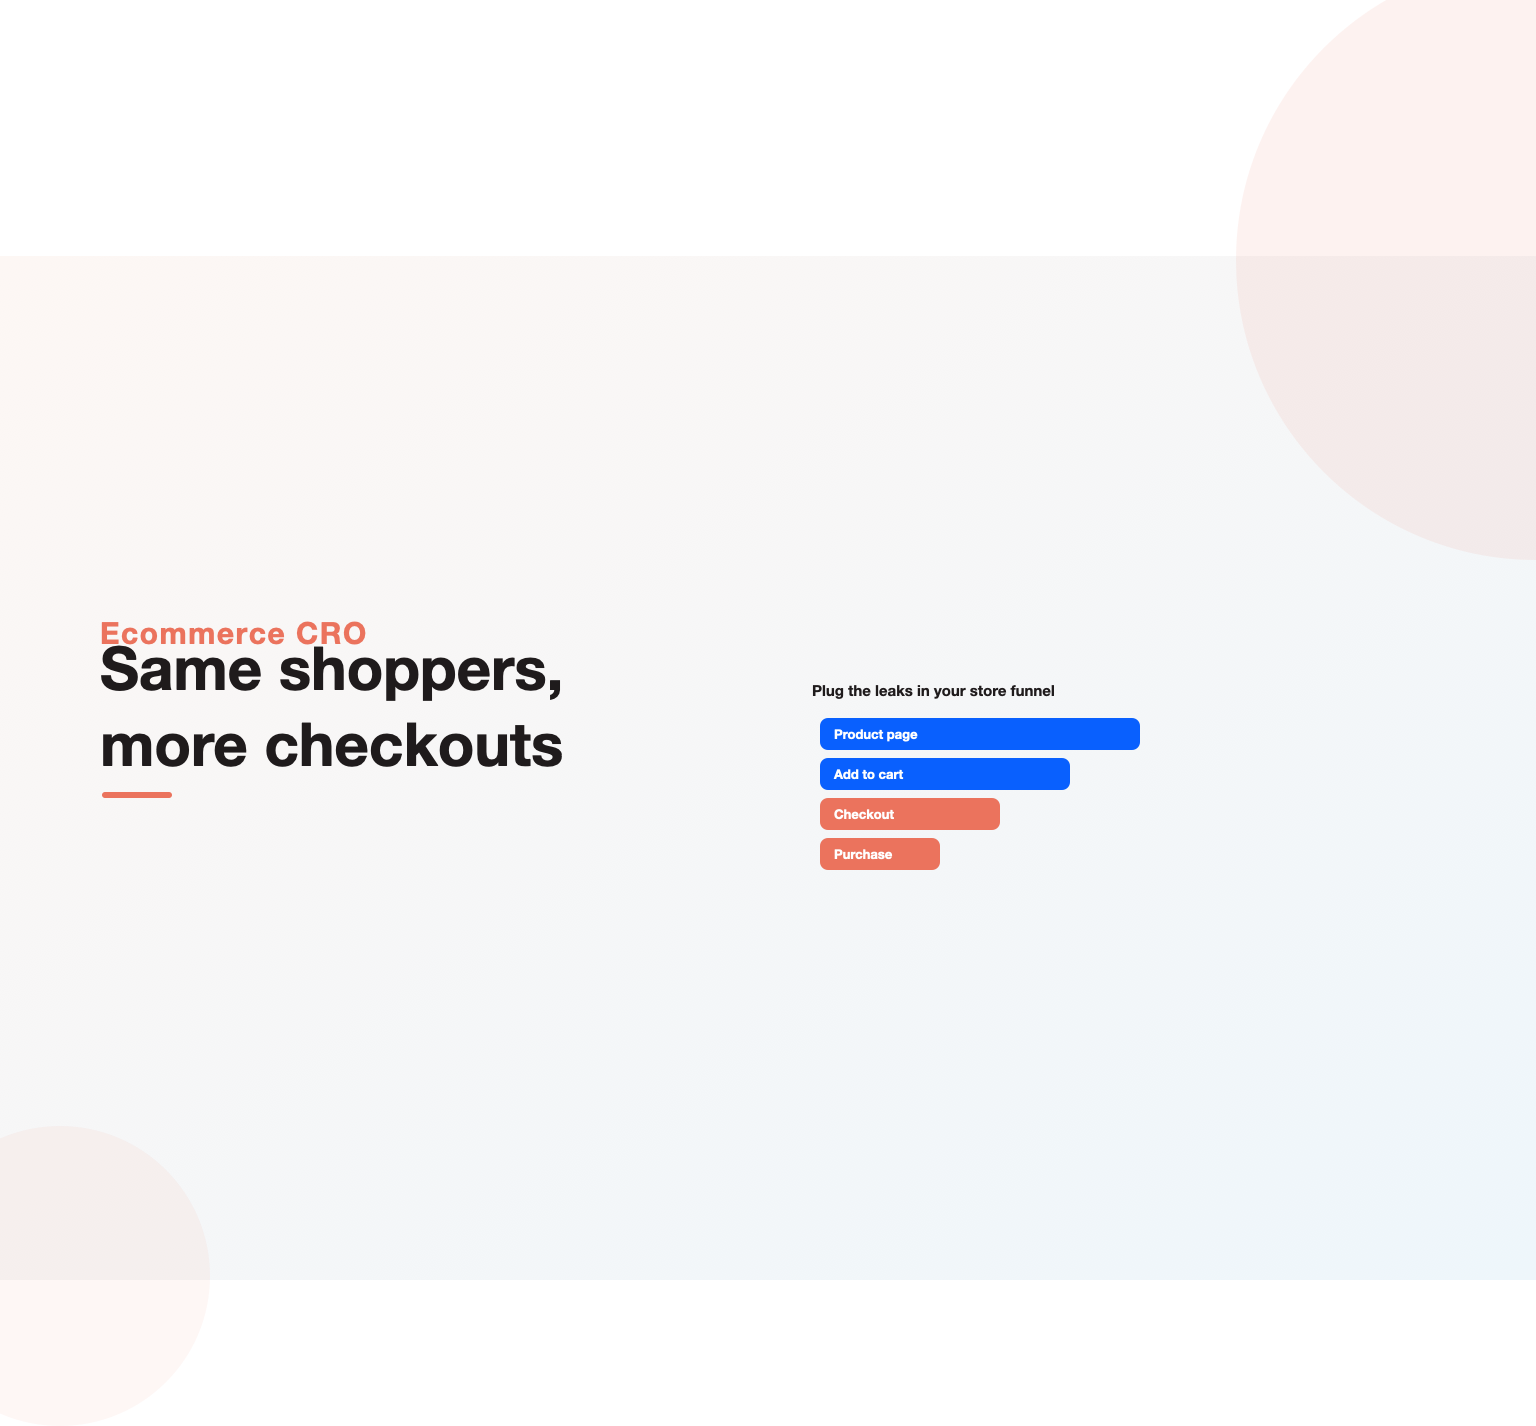
Ecommerce conversion rate optimization is the practice of raising the share of store visitors who complete a purchase by finding and fixing the leaks in your funnel: landing pages, product pages, the cart, and checkout. You measure where shoppers drop off, research why, test specific changes against the current experience, and keep only what lifts revenue per visitor. Most stores convert somewhere around 2 to 3 percent of sessions, so even a half point gained on the same traffic can be worth more than a bigger ad budget.
Key Highlights
- Why a store funnel has four distinct stages, and which metric belongs to each one.
- Benchmark ranges from cited sources, plus why your own baseline matters more than any industry average.
- A diagnostic routine using funnel reports, heatmaps, session recordings and on-site surveys.
- The product page, cart and checkout levers with the strongest published evidence behind them.
- How to size an A/B test properly so you do not ship false winners.
- A scoring model (ICE or PIE) for your backlog, and a 90-day plan you can start on Monday.
What ecommerce conversion rate optimization actually covers
Online retail has a peculiar shape. A lead-generation site usually asks for one thing, a form fill. A store asks a visitor to make a chain of small decisions: click into a category, open a product, pick a size, add to cart, start checkout, enter an address, choose shipping, pay. Each step sheds people. Good ecommerce conversion rate optimization treats that chain as a system and works on the weakest link first, rather than polishing a homepage banner because it is the most visible thing in the boardroom.
That focus separates it from general CRO. If you want the foundations of the discipline itself, our pillar guide on conversion rate optimization fundamentals walks through the research and testing loop in depth. Here we stay inside the store: SKUs, carts, shipping fees, payment methods, return policies and the mobile thumb that decides whether a basket survives.
Three outcomes matter to an operator. Conversion rate is the obvious one. Average order value is the second, because a shopper who buys two items instead of one is worth more even if the rate stays flat. Revenue per visitor combines both and is the number we recommend you treat as the headline. A change that lifts conversion while cutting order value can quietly lose money, and only revenue per visitor will reveal it.
Benchmarks: what a normal store converts at
Everyone wants to know whether their number is good. A fair answer starts with ranges, not a single figure. Shopify’s conversion rate guide notes that global averages tend to sit around 2 to 3 percent, with wide swings by industry and price point; luxury and jewelry, for example, converts well under 1 percent because baskets are expensive and considered. Cart abandonment tells the other half of the story. The Baymard Institute cart abandonment research, which averages dozens of studies, puts documented online cart abandonment at roughly 70 percent.
| Metric | Typical published range | Source | How to read it |
|---|---|---|---|
| Sitewide conversion rate | About 2% to 3% globally | Shopify | Highly category dependent; compare against your own trailing 90 days first |
| Luxury and jewelry conversion | Under 1% (about 0.6%) | Shopify | High price, long consideration; judge on revenue per visitor |
| Cart abandonment rate | Roughly 70% | Baymard Institute | Some abandonment is browsing; focus on the avoidable share |
| Mobile speed impact | 0.1s faster linked to 8.4% more retail conversions | Deloitte for Google | Speed work has measurable revenue value on mobile |
| Reviews effect | Five reviews linked to 270% higher purchase likelihood than zero | Spiegel Research Center | The first handful of reviews matters most |
Treat those figures as context, not targets. Traffic mix distorts averages badly. A store that gets most of its sessions from cold social video will convert lower than one fed by branded search and email, even if its pages are better. Segment your rate by channel, device and new versus returning visitors before you decide anything. A store with a 1.4 percent overall rate can turn out to convert 4 percent on desktop email traffic and 0.7 percent on mobile paid social, which is a very different problem to solve.
The four-stage store funnel and the metric for each
Breaking the funnel into stages turns a vague goal into a set of specific questions. Each stage has a leading metric, and each metric points to a different class of fix.
| Stage | Leading metric | Common leak | First thing to check |
|---|---|---|---|
| Landing or category page | Product page view rate | Mismatch between ad promise and page | Top landing pages by bounce and exit, split by source |
| Product detail page | Add-to-cart rate | Unclear price, shipping, sizing or trust | Scroll depth and clicks on images, reviews and size guide |
| Cart | Cart-to-checkout rate | Surprise costs, weak edit controls | Shipping display and promo code field behavior |
| Checkout | Checkout completion rate | Forced accounts, long forms, missing payment options | Field-level drop-off and error messages |
For ecommerce conversion rate optimization, the funnel report is your map. Set up these steps as a funnel exploration in GA4 using the standard GA4 ecommerce events: view_item, add_to_cart, begin_checkout, add_shipping_info, add_payment_info and purchase. If those events are not firing cleanly, stop. Ecommerce conversion rate optimization built on broken tracking produces confident decisions about the wrong pages. Spend the first week on measurement hygiene, including deduplicated purchase events and correct revenue values, before touching a single button.
Diagnosing leaks: numbers first, then behavior, then voice
Quantitative data tells you where shoppers leave. Qualitative data tells you why. You need both, in that order, because heatmaps on a page nobody visits are a waste of an afternoon.
Funnel and segment analysis
Pull the funnel by device first. Mobile usually carries most sessions and a lower rate, so a small mobile gain is often the largest dollar opportunity. Then split by landing page and channel. Look for steps where one segment falls far below the others; that gap is a candidate problem with a built-in control group.
Heatmaps and session recordings
Click maps and scroll maps show whether people reach your shipping information, whether they tap images that are not zoomable, and whether they rage-click a disabled button. Watch recordings filtered to sessions that added to cart and then exited. Twenty of those, viewed with a notepad, will surface more testable ideas than a month of debate. Our roundup of the best CRO tools compares the main heatmap, recording and testing platforms if you are choosing a stack.
Surveys and support tickets
Exit-intent polls with one open question, such as “What stopped you from buying today?”, collect the objections in the shopper’s own words. Support tickets and live chat logs are a goldmine too. When the same question about delivery time or return windows appears every week, the product page is failing to answer it.
Usability research from groups like the Nielsen Norman Group is worth reading alongside your own data, because it explains recurring patterns, such as shoppers ignoring content that looks like an ad, that your recordings will show but not explain.
Product page levers that move add-to-cart rate
For most stores the product detail page is where intent is won or lost. On this template, ecommerce product page optimization is less about clever design and more about answering every question a shopper would ask a salesperson in a physical store, before they have to ask it.
Imagery that replaces touch
Online buyers cannot pick a product up, so photos do that job. Show scale with the item in a hand or on a person, include close-ups of texture and stitching, and add a short video for anything that moves, folds or fits. Every image should be zoomable on mobile with a pinch. Missing angles are a classic reason shoppers open a competitor tab.
Reviews and social proof
Reviews carry unusual weight in retail. The Spiegel Research Center study on online reviews found purchase likelihood for a product with five reviews was 270 percent greater than for one with none. The practical lesson: getting each product from zero to a handful of genuine reviews matters more than chasing hundreds on your bestsellers. Post-purchase review request emails, photo reviews and visible star ratings near the price all help. Never filter out negative reviews; a perfect 5.0 reads as fake, and honest low ratings with replies build trust.
Shipping and returns clarity
Put the delivery estimate and shipping cost, or the free-shipping threshold, right beside the add-to-cart button, not buried in a footer link. State the return window in plain words. Uncertainty about extra costs is one of the most cited abandonment reasons in Baymard surveys, and the cheapest fix is simply showing the numbers earlier.
Trust signals that are specific
Generic badges add little. Specific reassurance works better: a named warranty length, a real phone number, a clear “ships from Ohio in 1 to 2 business days” line, payment logos for the methods you actually accept. Place them near the decision point rather than in a strip across the page header.
Copy that sells the outcome
Specification tables belong on the page, yet buyers decide on outcomes. Lead the description with what the product does for the person, then support it with materials, dimensions and care. Sizing guidance deserves special attention in apparel, where fit worries drive both abandonment and returns.
Cart abandonment and checkout friction
The cart and checkout are where a committed shopper becomes revenue or a statistic. With roughly seven in ten carts abandoned according to Baymard, small friction here has an outsized cost. Work through the items below in order of how often you see them in recordings.
- Show total cost, including shipping and tax estimates, in the cart rather than revealing fees on the last step.
- Offer guest checkout prominently. Account creation can happen after payment with one click.
- Cut form fields to the minimum. Combine first and last name if your fulfillment allows, use address autocomplete, and hide the second address line behind a link.
- Support the wallets your buyers already use, such as Apple Pay, Google Pay, PayPal and Shop Pay, plus buy-now-pay-later options where order values justify them.
- Make the promo code field less prominent. A large empty coupon box sends shoppers off to search for codes and many never return.
- Write inline error messages that explain the fix, and validate fields as people type instead of after they press submit.
- Keep the cart editable without page reloads: quantity, size and remove should work instantly.
- Repeat reassurance at payment: secure checkout, return policy and delivery date.
Recovery flows matter too. A well-timed abandoned cart email sequence wins back a share of shoppers who left for reasons you could not fix on the page, such as a phone call interrupting them. Treat recovery as a safety net, though, not a substitute for removing friction at the source.
Site speed and Core Web Vitals
Speed is a conversion lever with unusually strong evidence, and few areas of ecommerce conversion rate optimization have a cleaner link between engineering effort and money. The Deloitte “Milliseconds Make Millions” study, commissioned by Google, found that a 0.1 second improvement in mobile site speed was associated with an 8.4 percent increase in retail conversions. Faster pages also rank and crawl better, which is why speed sits at the overlap between CRO and the technical work in our ecommerce SEO tips.
Use Google’s Core Web Vitals as the shared language with your developers: Largest Contentful Paint for loading, Interaction to Next Paint for responsiveness, and Cumulative Layout Shift for visual stability. On stores the usual offenders are oversized hero images, a dozen third-party apps each loading their own scripts, and review or chat widgets that shift the layout as they appear. Audit installed apps quarterly and remove anything that has not earned its weight.
Mobile experience: where most of the revenue gap hides
No serious program of ecommerce conversion rate optimization can treat mobile as an afterthought. Mobile traffic typically outnumbers desktop on consumer stores, while converting lower. Part of that is behavior, since people browse on phones and buy later on laptops. Part of it is design debt. Check that the add-to-cart button stays reachable, ideally as a sticky bar, that filters on category pages open in a usable drawer, and that keyboards match the field: numeric for card numbers and postal codes, email layout for email.
Test on real mid-range Android phones over a throttled connection, not only on the founder’s new iPhone on office wifi. What feels instant in the office can take six seconds on a commuter train, and that is where a large share of your shoppers actually are.
Shopify conversion rate optimization specifics
Many operators reading this run on Shopify, so a few platform notes are worth calling out. Shopify conversion rate optimization starts with theme choice: a lean, well-maintained theme beats a feature-heavy one that ships every widget on every page. Shop Pay tends to be a strong accelerated checkout for returning Shopify shoppers, so make sure it is enabled and visible. Checkout customization is limited on standard plans, which pushes most of the testing effort onto product, collection and cart pages, and onto post-purchase upsells.
App sprawl is the most common Shopify speed problem we see. Each app can inject scripts sitewide, even on pages where it does nothing. If you need a theme rebuilt for speed or custom sections built cleanly, our Shopify development services team handles that work, and the same principles apply on WooCommerce, BigCommerce or Magento.
A/B testing method and sample size
Testing is how ecommerce conversion rate optimization turns opinions into evidence. A sound A/B test has one clear hypothesis, one primary metric, a pre-calculated sample size and a fixed run time. Skip any of those and you invite false winners.
Write the hypothesis properly
Use a simple frame: because we observed X in research, we believe changing Y for segment Z will increase metric M. “Because recordings show mobile shoppers scrolling past shipping info, moving the delivery estimate beside the button will raise mobile add-to-cart rate.” That sentence ties the test to evidence and tells you what to measure.
Size the test before you launch
Sample size depends on your baseline rate and the smallest lift you care to detect. Evan Miller’s sample size calculator is a reliable free tool. As a rough illustration, detecting a 10 percent relative lift on a 3 percent baseline at standard settings needs tens of thousands of visitors per variant. Smaller stores should therefore test bold changes on high-traffic pages, or test higher in the funnel where rates are larger, such as add-to-cart instead of purchase.
Run it cleanly
Run for full weeks, at least two business cycles, so weekday and weekend shoppers are both represented. Do not peek and stop the moment a dashboard turns green; early results swing wildly. Watch revenue per visitor and average order value alongside conversion, and check that the split is close to 50/50 so a tracking bug is not masquerading as a result.
Low-traffic alternatives
Below roughly a few hundred orders a month, formal testing gets slow. In that case lean on research-backed changes, ship them, and compare before and after periods carefully while controlling for seasonality and ad spend. Usability tests with five to eight target customers will also reveal the worst problems quickly.
Prioritizing the backlog with ICE or PIE
Research produces more ideas than you can test, and a backlog that is never ranked becomes a wish list. A healthy backlog for a mid-sized store often holds forty or more ideas at once, each with a note linking it to the recording, survey answer or funnel gap that inspired it. Scoring frameworks stop the loudest voice from setting the roadmap. ICE rates each idea on Impact, Confidence and Ease from 1 to 10. PIE, popularized in CRO circles, uses Potential, Importance and Ease, where Importance reflects how much valuable traffic the page receives.
| Idea | Impact | Confidence | Ease | ICE score |
|---|---|---|---|---|
| Show delivery estimate beside add-to-cart on mobile | 7 | 8 | 9 | 8.0 |
| Enable express wallets on cart page | 8 | 7 | 7 | 7.3 |
| Add review request flow for zero-review products | 6 | 7 | 6 | 6.3 |
| Full product page redesign | 8 | 4 | 2 | 4.7 |
Scores in that table are illustrative, not results. The point is the shape: quick, evidence-backed fixes on high-traffic templates float to the top, while expensive redesigns with weak evidence sink until research earns them a place. Rescore monthly as tests finish and new data arrives.
Why ecommerce conversion best practices need testing, not copying
Lists of ecommerce conversion best practices are everywhere, and many of them are sound starting points. The trap is copying them blind. A sticky add-to-cart bar can help a long apparel page and annoy shoppers on a short one. Urgency timers can lift sales briefly and erode trust if they reset on refresh. Use best practices as hypotheses, validate them against your own shoppers, and keep a log of what worked so the knowledge compounds across the team.
Some practices are close to universal and rarely need a test: showing prices including all known costs, keeping guest checkout, making images zoomable and keeping the site fast. Spend testing capacity on the questions where your audience could genuinely go either way, such as bundle offers, free-shipping thresholds, or the order of information on the product page.
Choosing which strategies to run first
Readers often ask for a ranked list of ecommerce conversion rate optimization strategies, and the honest answer is that the order depends on where your drop offs happen. If you want to know how to increase conversion rate ecommerce teams can actually sustain, start with the stage that loses the most website visitors in absolute numbers, not the one that looks worst in percentage terms. A product page that loses 60 percent of 100,000 visitors is a bigger prize than a checkout step that loses 40 percent of 5,000.
Conversion rate optimization for ecommerce also benefits from layering. Fix page speed and tracking, then clarify costs and trust, then move to merchandising tests such as bundles and thresholds, and only then explore ai driven personalization, which needs clean data and enough traffic to learn from. Jumping straight to personalization on a slow, confusing store is like tuning the engine of a car with flat tires. Stores that follow this order tend to see their ecommerce conversion rate climb steadily rather than in one lucky spike, and every stage builds on the evidence the previous stage produced. Mature cro strategies are built this way: one stage at a time, with each result written down.
How to improve ecommerce conversion rate in 90 days
Plans fail when they try to do everything. This one runs in three 30-day blocks, each with a clear output. It assumes a store with steady traffic and someone who can ship front-end changes each week.
Days 1 to 30: measure and research
- Audit GA4 ecommerce events and fix duplicated or missing purchase data.
- Build the four-stage funnel report split by device and channel, and record the baseline.
- Install heatmaps and recordings on the top landing, product and cart templates.
- Launch a one-question exit survey and read the last 90 days of support tickets.
- Produce a backlog of 20 to 40 ideas, each tied to a piece of evidence.
Days 31 to 60: fix and launch the first tests
- Ship the no-brainer fixes immediately: broken elements, hidden shipping costs, slow scripts.
- Score the backlog with ICE, then launch the top two tests on the highest-traffic templates.
- Start the review request flow so zero-review products begin collecting social proof.
- Remove or defer third-party apps that hurt Core Web Vitals.
Days 61 to 90: learn and compound
- Read results on revenue per visitor, not only conversion rate, and document every outcome.
- Roll out winners, then run follow-up tests that push the winning idea further.
- Move testing deeper into cart and checkout once the product page work is stable.
- Present the before and after funnel to stakeholders with the next quarter’s backlog.
Ninety days will not finish the job, because shoppers, competitors and channels keep changing. It will give you a working system, which is the real asset. Treated as a habit, ecommerce conversion rate optimization keeps paying back every month you run it.
Where CRO meets traffic acquisition
Conversion work and acquisition are two halves of the same economics. Every point of conversion lift lowers your effective customer acquisition cost on every channel at once, which lets you bid more aggressively in paid search and social without losing margin. That is why we plan CRO alongside ecommerce PPC management: landing page relevance, ad promise and product page content should tell one consistent story.
Organic search connects in the same way. Category and product pages that rank need to convert the visitors they win, and pages that convert well tend to earn better engagement signals. If you are newer to the organic side, our explainer on what ecommerce SEO is covers how those pages get found, and our ecommerce SEO services pair naturally with conversion work.
Common mistakes that waste a quarter
Several patterns show up again and again when stores ask us why their testing program stalled.
- Testing button colors while shipping costs are hidden until the final step.
- Calling tests after three days because the dashboard looked exciting.
- Measuring only conversion rate, then discovering a discount test cut margin.
- Running tests on pages with too little traffic to ever reach significance.
- Ignoring mobile because the leadership team reviews the site on desktop.
- Letting the app count creep upward until the store loads like a slideshow.
- Skipping documentation, so the same losing idea gets tested twice a year later.
Avoiding these is less about tools and more about discipline. A small team with a clear process will outperform a large one that treats ecommerce conversion rate optimization as a list of tactics to try at random.
Should you run CRO in-house or with a partner?
In-house teams know the product and customer deeply, which is an advantage in research. What they often lack is testing capacity, statistical rigor and a library of patterns from many stores. Agencies bring the opposite strengths. Many operators settle on a hybrid: an internal owner who sets priorities and an outside team that runs research, builds tests and analyzes results.
When you evaluate a partner, ask how they size tests, what metric they report on, and how they handle inconclusive results. Anyone promising a guaranteed percentage lift before seeing your data is guessing. If you would like us to look at your funnel, our conversion rate optimization services start with a research-led audit of the four stages, and you can contact our team to book a review. For a wider view of the discipline beyond stores, revisit our CRO pillar guide.
Key takeaways
- Make revenue per visitor your headline metric, with conversion rate and order value as its two drivers.
- Fix tracking before anything else; decisions built on broken GA4 events are worse than no decisions.
- Show shipping costs, delivery dates and return terms early, since surprise costs drive avoidable abandonment.
- Get every product from zero reviews to a handful; that first jump carries outsized weight.
- Treat speed as revenue work, especially on mobile, and audit apps every quarter.
- Size every A/B test in advance, run full weeks, and never stop early on a lucky streak.
- Score ideas with ICE or PIE, rescore monthly, and keep a written log of every result.

Frequently asked questions
What is ecommerce conversion rate optimization?
Put simply, ecommerce conversion rate optimization is the process of increasing the percentage of online store visitors who buy, by researching where and why shoppers drop out of the funnel and testing changes to landing pages, product pages, the cart and checkout.
What is a good conversion rate for an online store?
Shopify notes that global averages tend to sit around 2 to 3 percent, but category, price point and traffic source shift that a lot. Luxury stores can convert under 1 percent and still be healthy. Compare against your own baseline by device and channel.
How do I reduce cart abandonment?
Show total costs early, keep guest checkout, cut form fields, add express wallets, tone down the coupon field and write helpful error messages. Baymard research puts average abandonment near 70 percent, so a recovery email flow is a useful backup too.
How long should an ecommerce A/B test run?
Run until you reach the sample size calculated before launch, and for at least two full weeks so different days of the week are represented. Stopping as soon as a result looks significant leads to false winners.
Does site speed really affect sales?
Yes. A Deloitte study commissioned by Google found a 0.1 second mobile speed improvement was associated with an 8.4 percent lift in retail conversions. Core Web Vitals are a practical way to track it.
What should I fix first on a product page?
Start with whatever your research says shoppers cannot find: usually shipping cost and delivery time, sizing guidance, image coverage and reviews. Put those answers near the add-to-cart button.
Is Shopify conversion rate optimization different from other platforms?
The principles are the same, but Shopify limits checkout customization on standard plans and app sprawl is a frequent speed problem, so most testing happens on product, collection and cart pages.
Can small stores do CRO without much traffic?
Yes. Lean on research, usability sessions with a few customers, and clear before and after comparisons. Test bold changes higher in the funnel, where rates are bigger and results arrive sooner.
Ready to put this into practice?
Talk to the team that runs SEO, AI search and paid growth programs every day.
Book a Strategy Call →